 01 Connected Assets
 02 Safety & Compliance
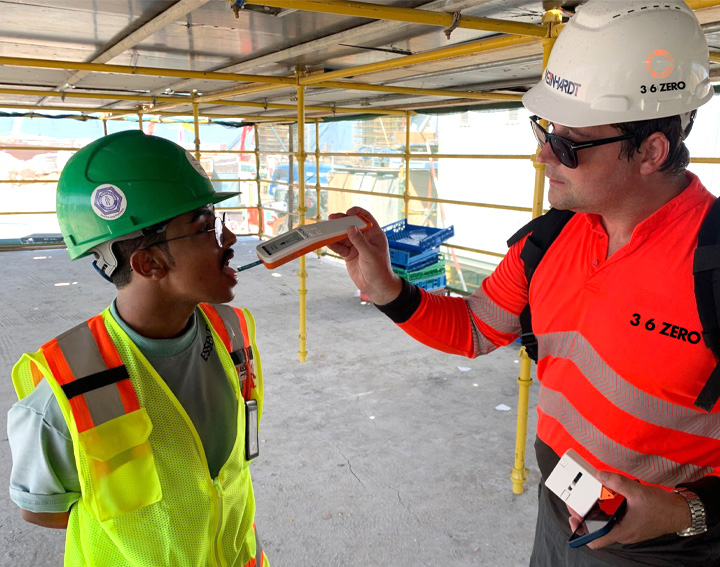
 03 Worker Welfare
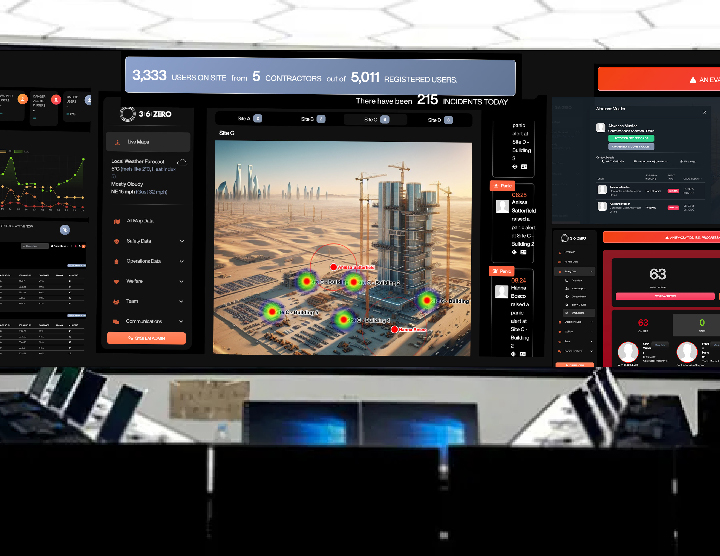
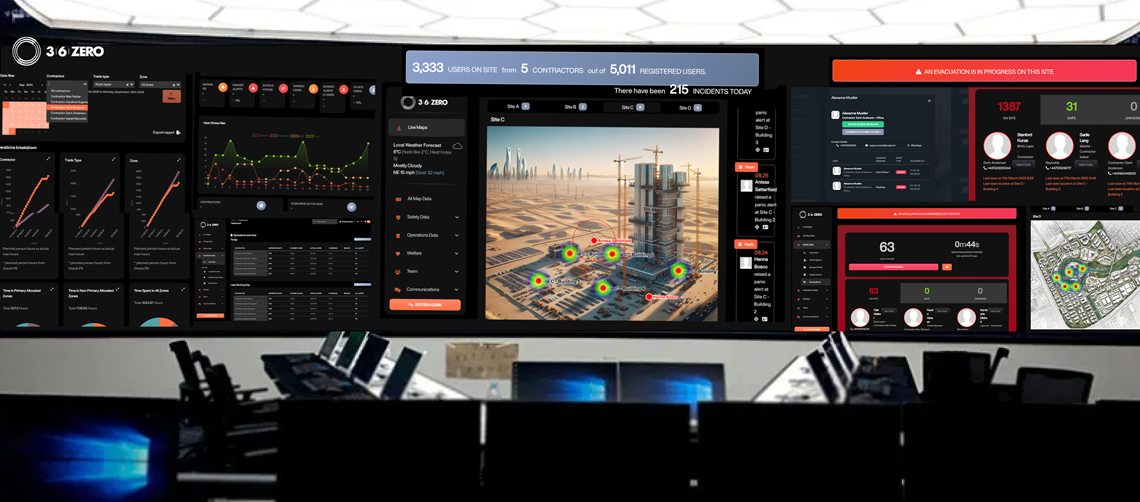
36Zero in practice
We analysed 12,070 users over the period of a month, capturing a 20% decrease in project activity overrun, and saving $4m in additional unplanned costs. This sample gives an idea of the breadth of knowledge-gathering that’s possible with our platform.
Workforce
management
Example – Compare today’s labour count to yesterday’s labour count for Contractor A in Zone B. Cross reference and correlate with Oracle P6 Program activity progress. Show me weather impact and arrival time of materials to Zone B? Show me how activity output can be improved for tomorrow?
- Total dwell and hoist time across all contractors
- Total work time spent in primary work zone
- Total planned labour hours this month vs. actual delivered
- Total number of return visit for job task completion
- AI image risk alerts captured
- Total cost of labour spent vs. actual received
Worker
welfare
Example – Correlate heat stress risk and heart rate alerts with accidents and incidences of danger and panic alerts. Show me output variance decrease when contractors’ aggregated combined workers’ health score is less than 65/100?
- Heat map of all heat stress alerts recorded this month
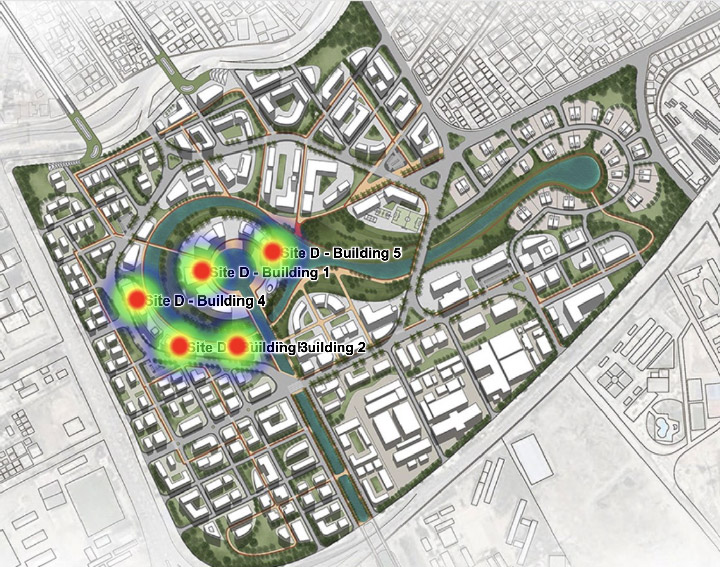
- Show location of most near misses
- Real time heat stress and heart rate warnings by contractor
- Total number of workers with health score <75/100
Safety &
compliance
Example – discover where and when the highest percentage of danger alerts occurred, and trends for these interventions.
- Percentage of incidents caused by specific contractors
- Filter all workers with certification/permits for specific zones
- Filter all danger alerts per floor
- Determine the average duration of a worker on site before first warning